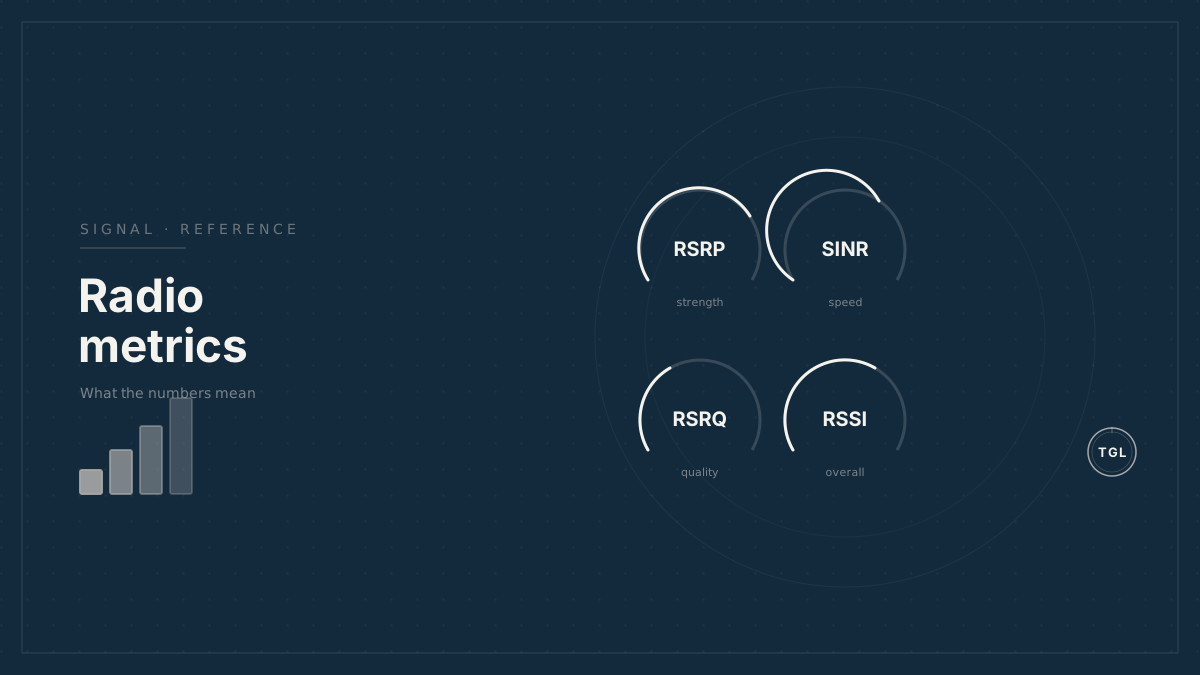
Understanding Cellular Radio Metrics: RSRP, RSRQ, SINR, and RSSI
A plain-language guide to the four signal numbers shown on a Teltonika router's mobile status page — what each one means in real life, and the rough thresholds for good versus poor.
Open the Status → Network → Mobile page on a Teltonika router (or any LTE/5G device) and you’ll see four signal numbers: RSRP, RSRQ, SINR, and RSSI. This guide explains what each one means in plain language so you can tell a healthy connection from a struggling one.
You don’t need to be an RF engineer. Two quick rules cover most of it:
- All four are measured in dBm or dB, and numbers closer to zero are better
— so
-85is a stronger signal than-105. - Good RSRP gets you connected; good SINR gets you speed.
Using these numbers to actually tune your connection? See the companion how-to, Improving LTE/5G Performance with Manual Band Selection on Teltonika Routers, which walks through disabling bands one at a time and speed-testing to find the best one.
RSRP — how strong the signal is#
The raw strength of the tower’s signal reaching you. Think of it as “how loud” the tower is. It’s the first thing to check, but a strong signal in a noisy or crowded area can still be slow.
| RSRP (dBm) | Real-world feel |
|---|---|
| −80 or higher | Excellent — right next to a tower |
| −80 to −90 | Good — reliable, fast |
| −90 to −100 | Fair — usable, may slow under load |
| −100 to −110 | Poor — drops, buffering likely |
| Below −110 | Marginal — often unusable |
RSRQ — the quality of that signal#
Strength isn’t everything. RSRQ factors in interference and how busy the tower is. A strong signal (good RSRP) with poor RSRQ usually means a congested tower — lots of other users competing for it.
| RSRQ (dB) | Real-world feel |
|---|---|
| −10 or higher | Good — clean, uncongested |
| −10 to −15 | Fair — workable |
| −15 to −20 | Poor — congested or interfered |
| Below −20 | Bad — expect problems |
SINR — the best predictor of speed#
Signal versus noise. Of the four, SINR tracks real download speed most closely. High SINR means the router can use faster, denser data encoding; low SINR forces it to slow down to stay reliable. If you only watch one number while comparing bands or moving an antenna, watch this one.
| SINR (dB) | Real-world feel |
|---|---|
| 20 or higher | Excellent — full speed |
| 13 to 20 | Good — fast |
| 0 to 13 | Fair — slower, variable |
| Below 0 | Poor — noise is drowning the signal |
RSSI — overall received power#
A coarse, older measure of total power received, including noise and signal from neighbouring cells. It’s a rough strength gauge; RSRP, RSRQ, and SINR are more precise, so use RSSI only as a quick sanity check.
| RSSI (dBm) | Real-world feel |
|---|---|
| −65 or higher | Excellent |
| −65 to −75 | Good |
| −75 to −85 | Fair |
| Below −85 | Poor |
Putting it together#
When you’re comparing two options — two bands, two antenna positions, two parking spots — don’t judge by a single number:
- Start with RSRP to confirm you have enough signal to connect at all.
- Then compare SINR, because that’s what most closely predicts actual speed.
- Use RSRQ to spot congestion: strong RSRP but weak RSRQ usually means a busy tower.
- Treat RSSI as a rough sanity check only.
Rule of thumb: when two bands have similar RSRP, pick the one with the higher SINR.